Send your areas
Boundaries as polygons with your own IDs, or a list of postcodes. Say which areas matter for the pilot.
Datasheet
Canopy cover, open space and impervious ratio measured from imagery, delivered as a CSV with the components behind the score.
Each delivery is one score per area with the three measurements behind it. The set refreshes once a year, and every file is keyed to your area IDs.
| File | Format | What's in it | Cadence |
|---|---|---|---|
| Location-quality score | CSV | One row per area: your area ID and a single comparable score. Built from the three components with the weighting set out in the methodology note. An area can be a postcode, an output area, an LSOA or a custom polygon you send. | Annual. |
| Component metrics | CSV | Canopy cover percent, open space percent and impervious percent on the same rows as the score. Use them to build your own blend, or to explain a score on a listing page. | Annual. |
| API-style export | JSON | The same fields, keyed by area ID, for a listing page that pulls the score live instead of loading a file. | Annual, refreshed with each delivery. |
| Methodology note | How each component is measured, how the score is weighted and which imagery season the delivery uses. Read it before any figure goes in front of a home-buyer. | One per delivery. | |
| Year-on-year refresh | CSV | A new delivery each year on the same area IDs, so you can compare one year with the next. | A pilot starts with one delivery for the areas you choose. |
Boundaries as polygons with your own IDs, or a list of postcodes. Say which areas matter for the pilot.
High-res RGB + NIR imagery over those areas from one annual leaf-on season, so every area is scored from the same season.
Each pixel goes to canopy, open space or impervious surface, and the shares are added up per area.
The three components become one comparable number per area, using the weighting in the methodology note.
CSV or API-style export, keyed to your area IDs, ready to join to your listing and postcode tables.
These are the conditions that move the numbers. The methodology note repeats each one.
| Condition | Effect on the output | What it means for the delivery |
|---|---|---|
| 0.5–2 m sets the floor | At the coarse end a pixel covers several square metres. A single garden tree, a hedge or a narrow verge can merge into its neighbours or drop out, so canopy in dense back gardens reads low where the imagery is coarsest. | Street-scale and neighbourhood-scale shares are the sound unit; any one plot is not. |
| Visible cover only | Canopy and open space are read from above. A private garden and a public park both count, and the score cannot tell them apart. | It says nothing about whether anyone can walk into the space. |
| Leaf-on season | Deciduous canopy looks different across the year. | The capture date sets the reading, and areas imaged in a different season are flagged in the delivery rather than blended. |
| Cloud cover | A cloudy annual pass over an area can delay that area's score. | Delayed areas are listed in the delivery and left unfilled. |
| Shadow and tall buildings | Shade from towers and tall trees hides the ground beneath. | Dense centres carry more uncertainty than low-rise suburbs. |
| No certification | This is an independent comparable measurement. | No government, planning or certification body rates anything here, and the score says nothing about what a home will sell for. |
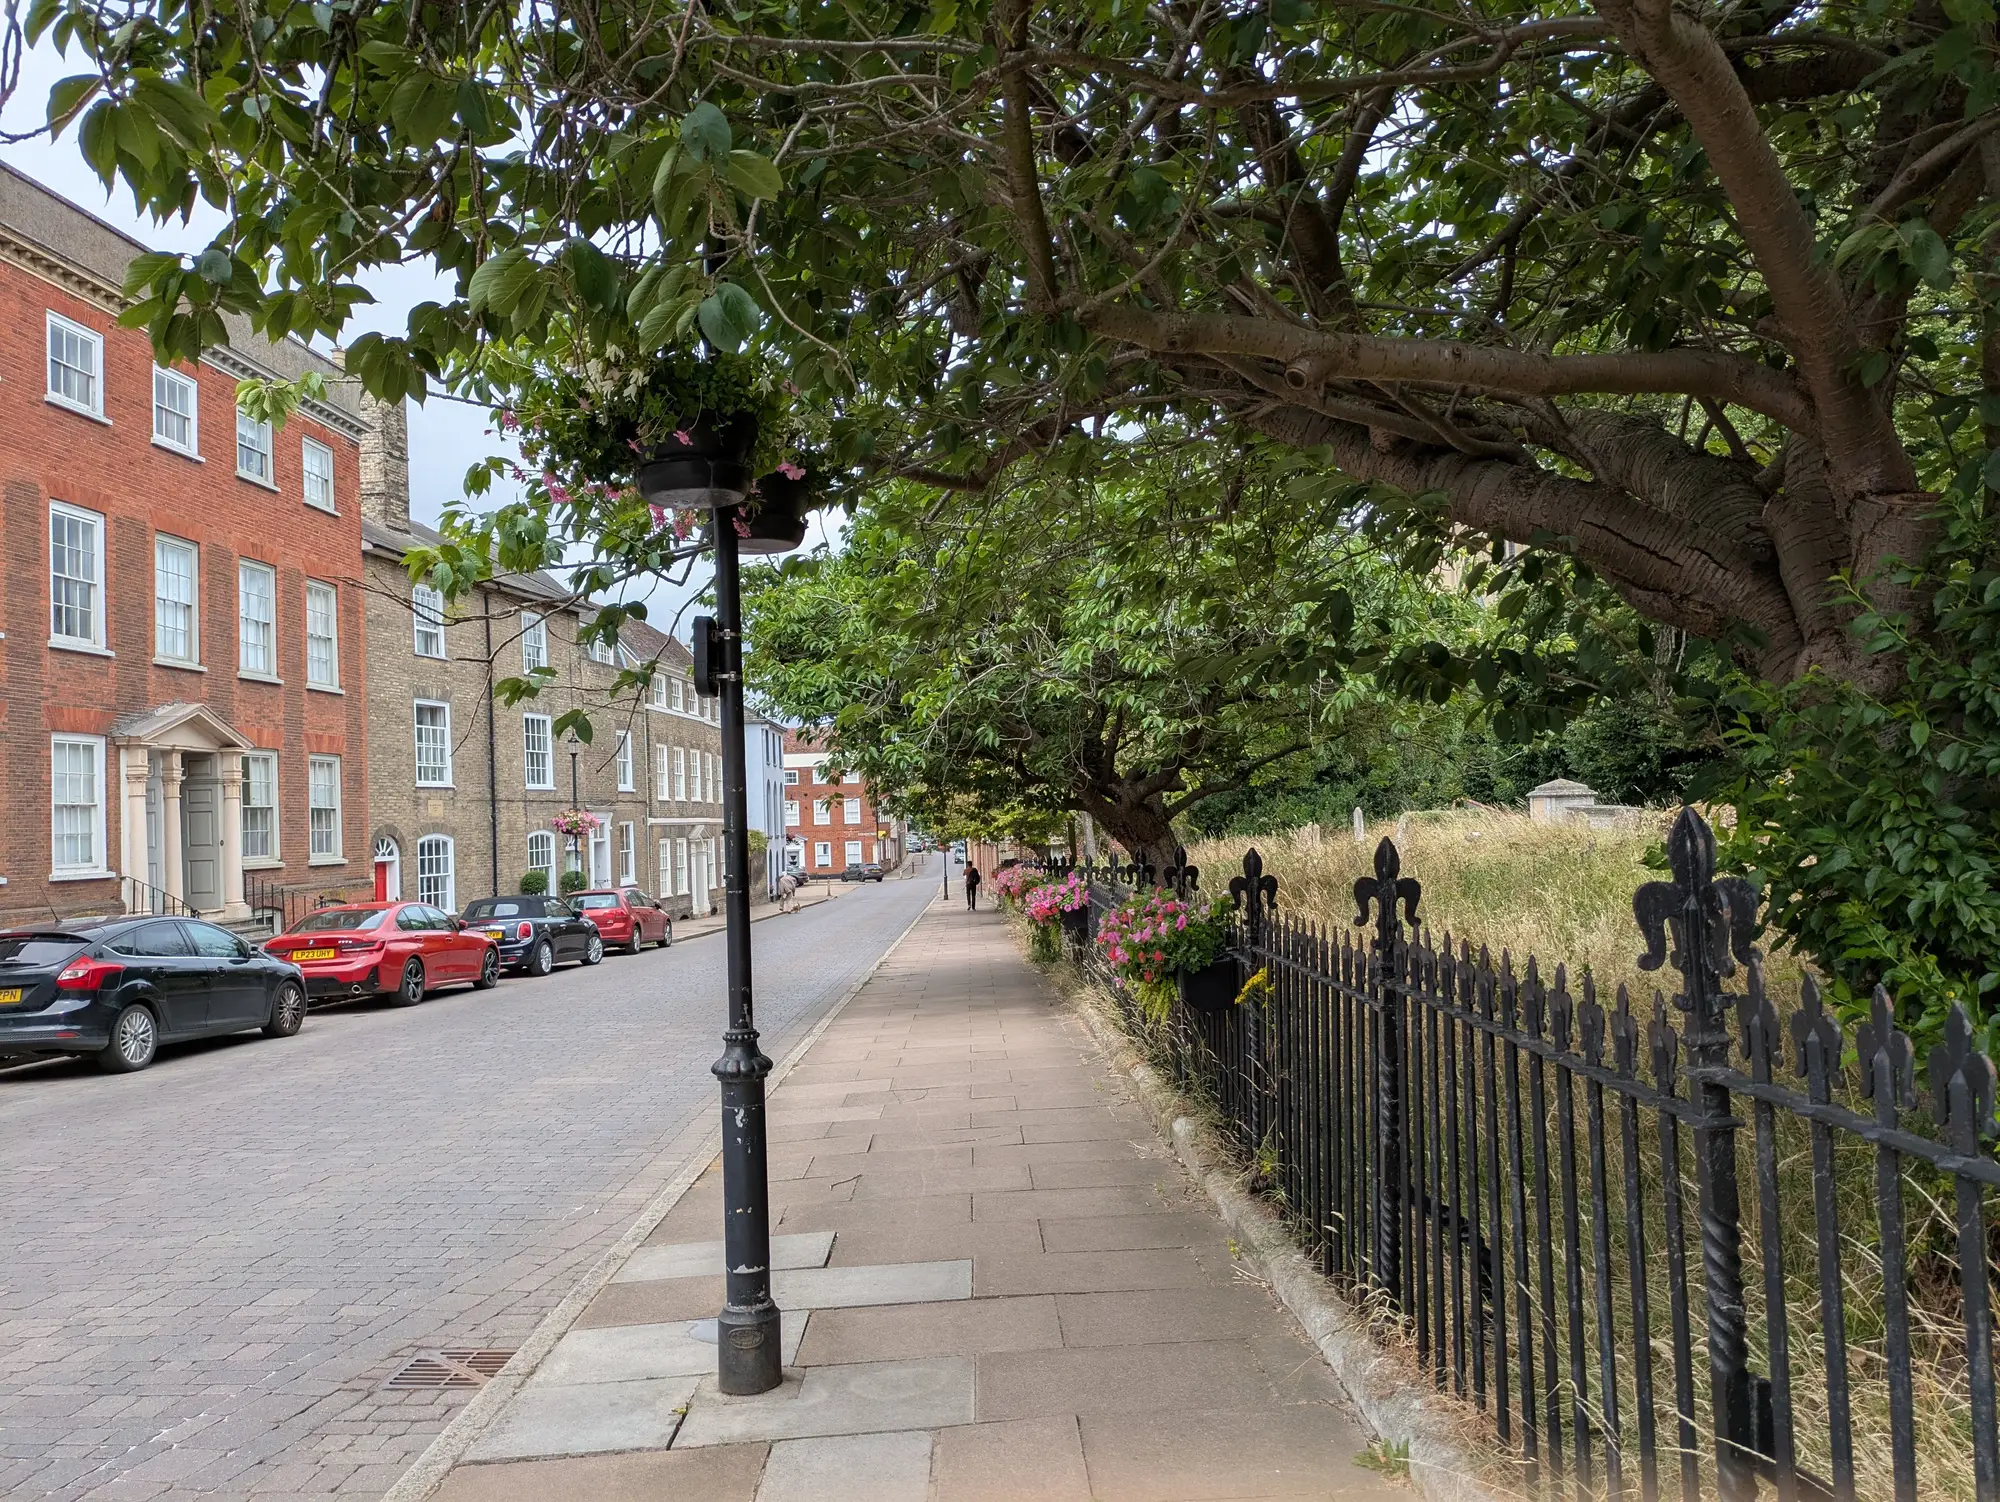
Your neighbourhood panel has a walkability number, school ratings and a commute time. For greenery it has a count of parks from the open greenspace layer, or a vegetation index averaged over a whole LSOA.
The park count misses tree-lined streets and every private garden, and the average lumps a reservoir in with a terrace. Then someone in search asks why two very different neighbourhoods carry the same figure, and you have nothing finer to open.
No. It is our own comparable measurement from imagery, and no government or certification body issues it.
No. Canopy and open space are visible cover. Ownership and access are not in the imagery.
The weighting is written up in the methodology note delivered with the data.
Yes. The three components sit on every row, so you can build your own blend and keep ours as a comparison.
Deciduous canopy reads fuller in leaf. The capture date affects the reading, and the methodology note names the season each delivery uses.
Yes. A cloudy pass can delay an area's update, and delayed areas are marked in the delivery.
Join the components to your area table and compare with whatever greenery layer you hold, whether that is an NDVI average or a greenspace count. Tell us your reference data during scoping and we will say where we expect the two to differ.
Use and ownership terms for the files are agreed in the contract before the pilot starts. The imagery sources keep their own licences.
Each pilot is scoped and quoted on its own, from the areas you choose and how you plan to use the score.