Blog
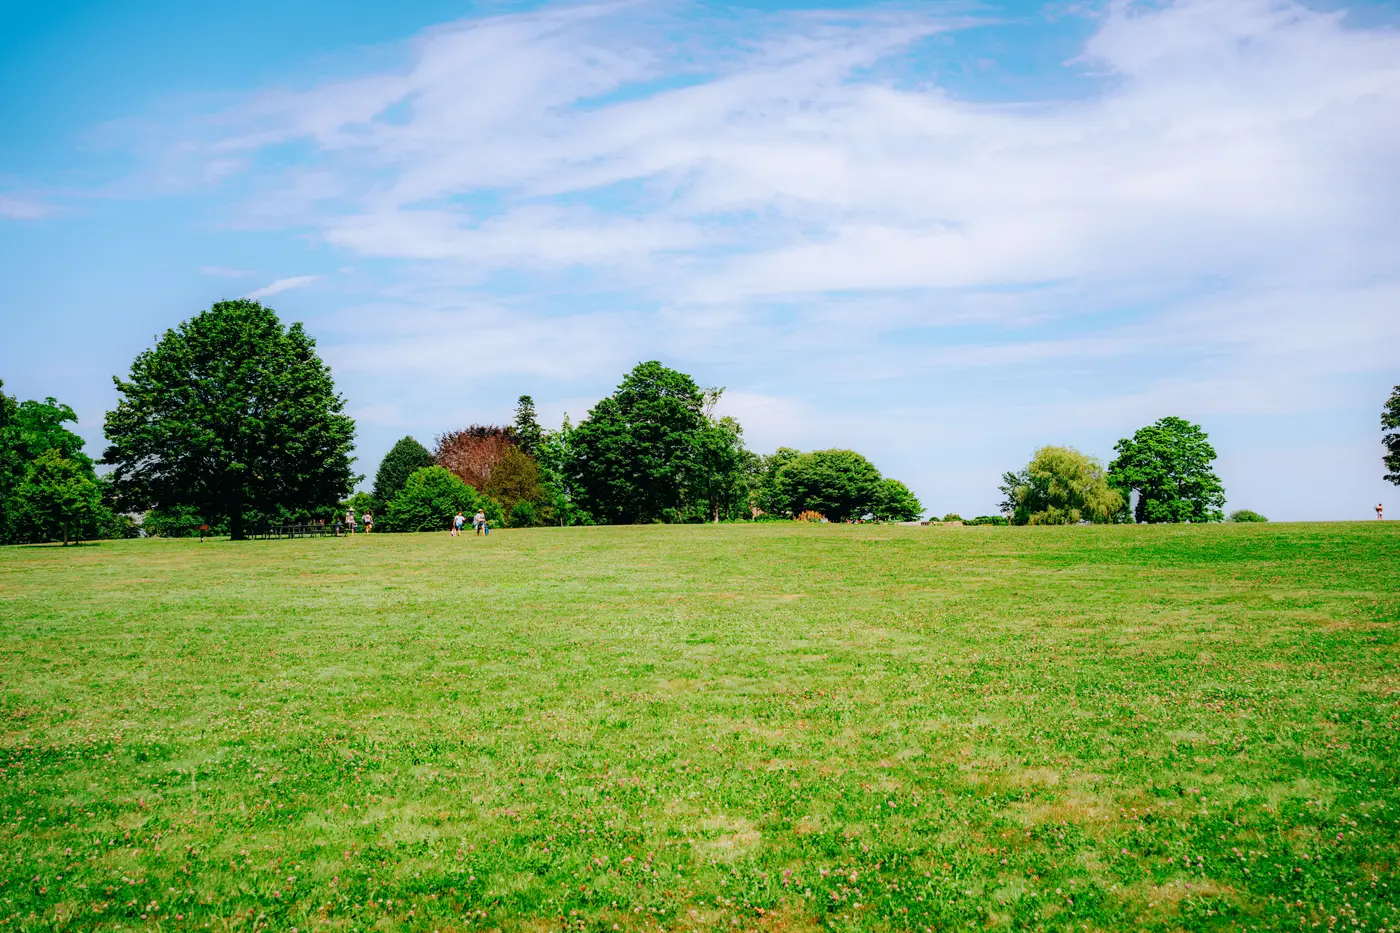 Field notes: the week a cemetery almost counted as open space
A location-quality analyst on why a cemetery polygon nearly inflated a listing area's green score, and what it exposed about "open space" as a category.
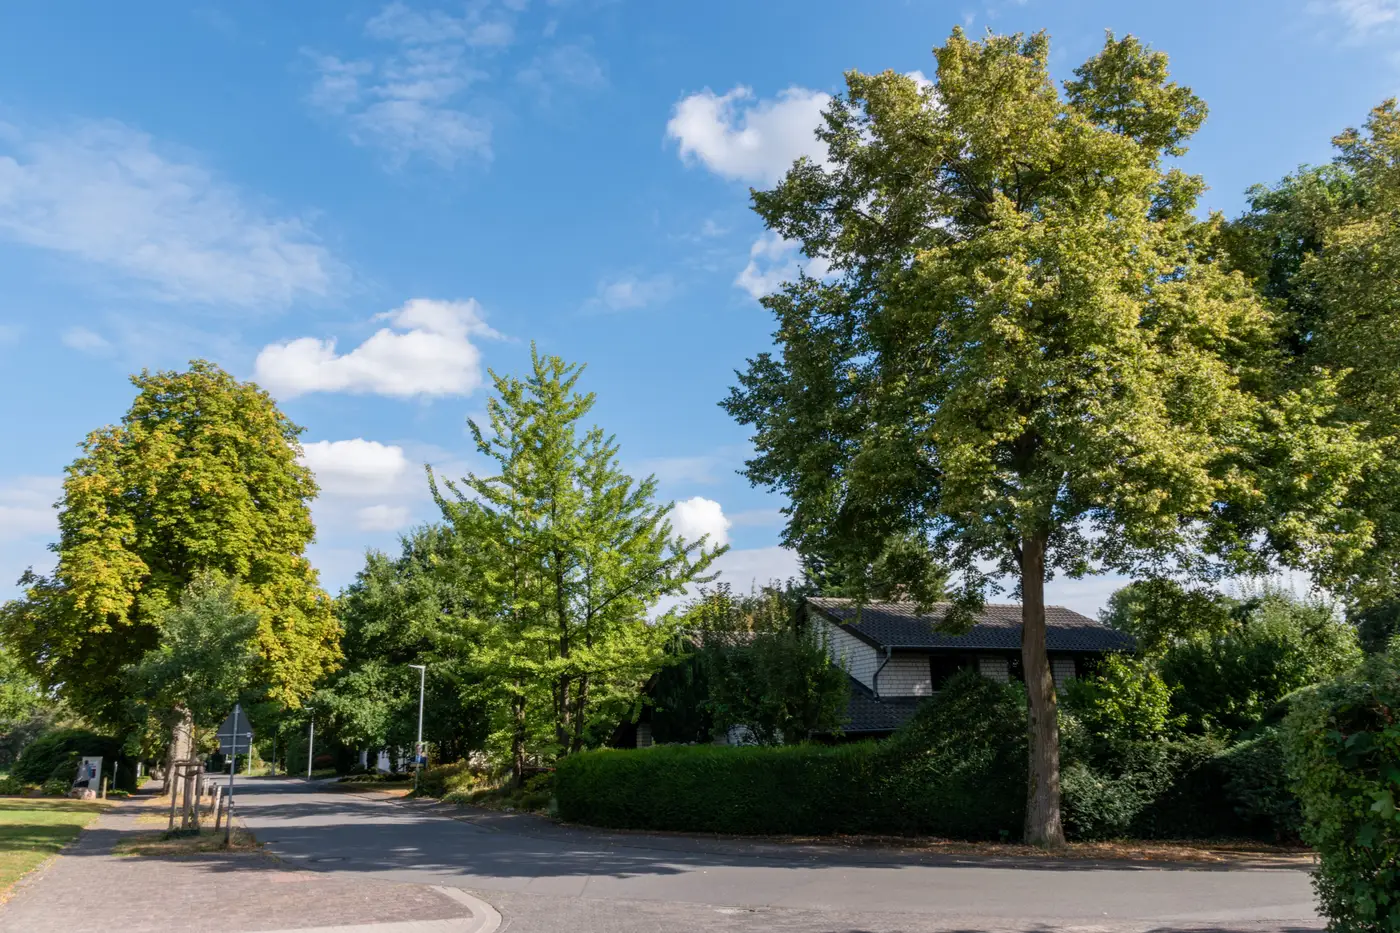 Impervious ratio vs canopy cover: which one moves the score more?
A look at how canopy cover and impervious surface percentage each pull on a location-quality score, and why the bigger swing isn't always the one you'd guess.
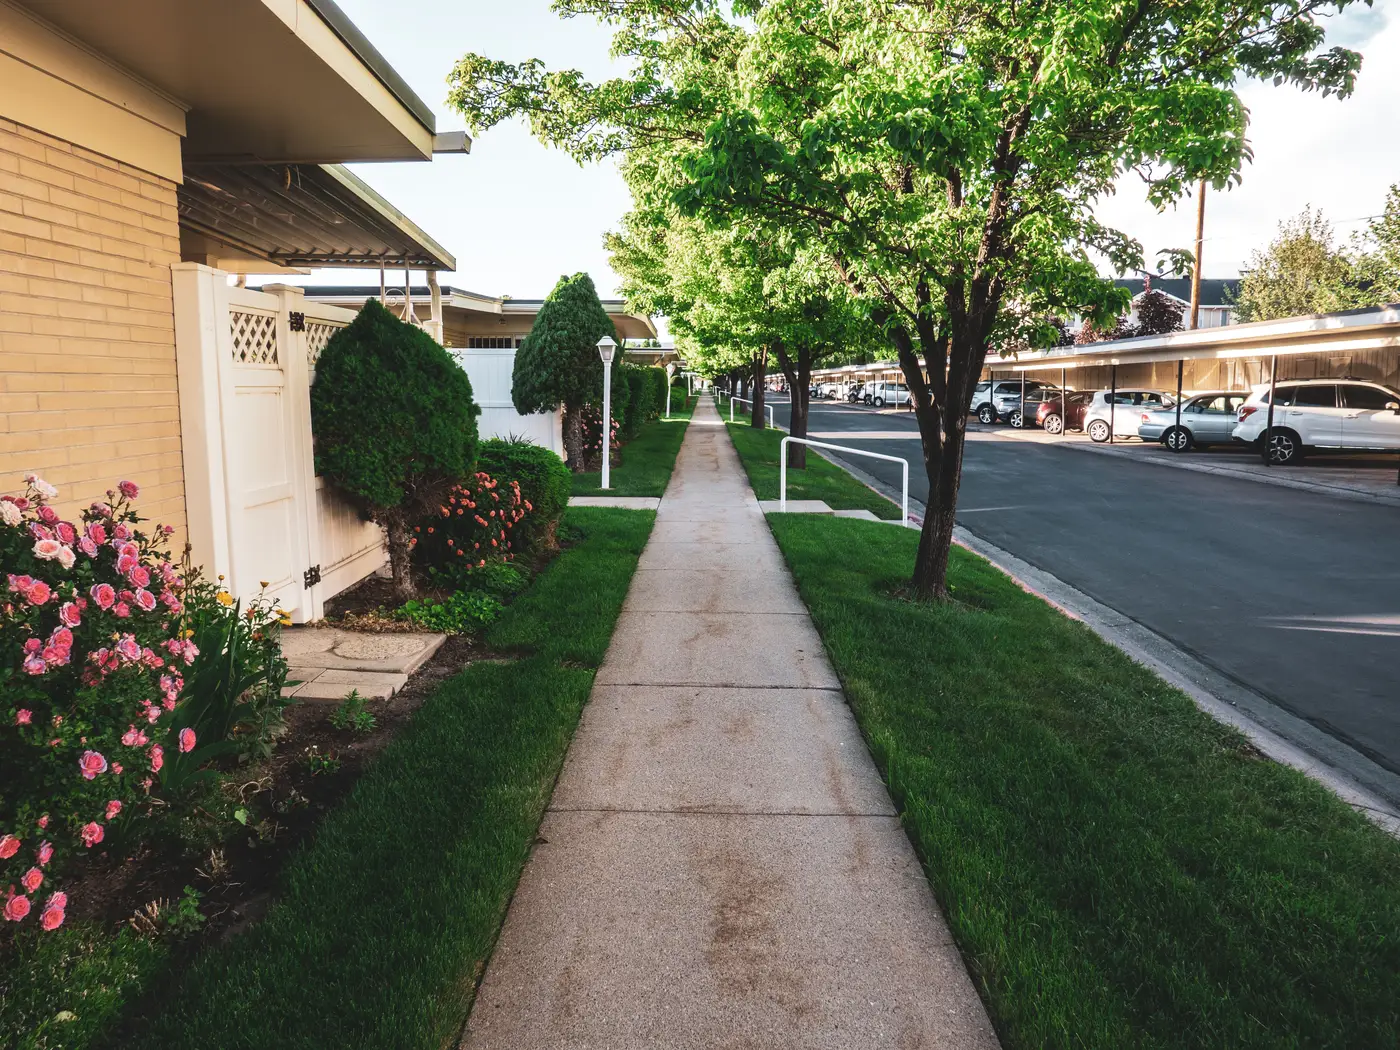 Does canopy cover raise sale price? reading the research without the hype
A look at what canopy-and-price research shows, and why a single percentage number isn't enough to price a leafy street.
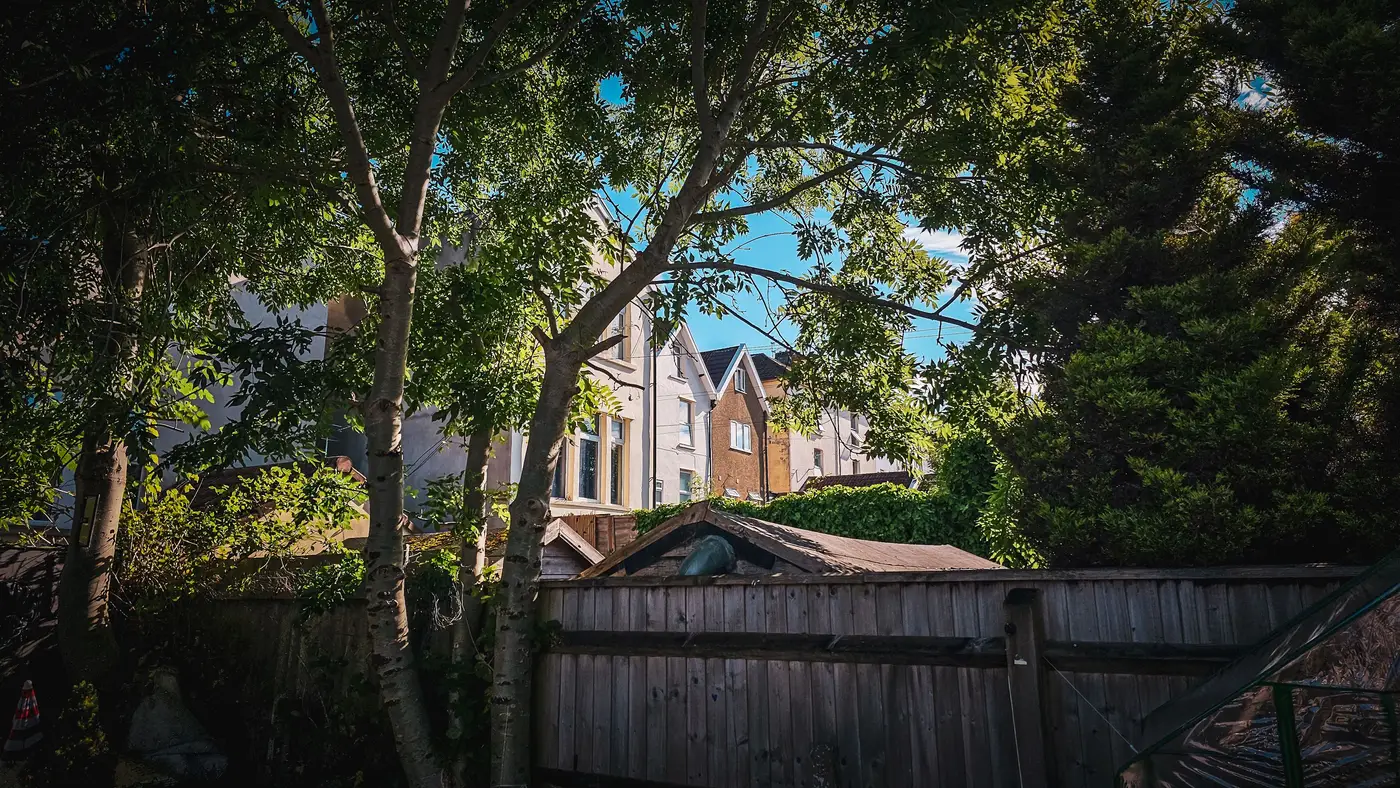 Street tree canopy vs private yard canopy: what a greenness score actually counts
Right-of-way trees and backyard trees both read as "green" on a map, but they score differently. Here's how a per-area canopy score tells them apart.
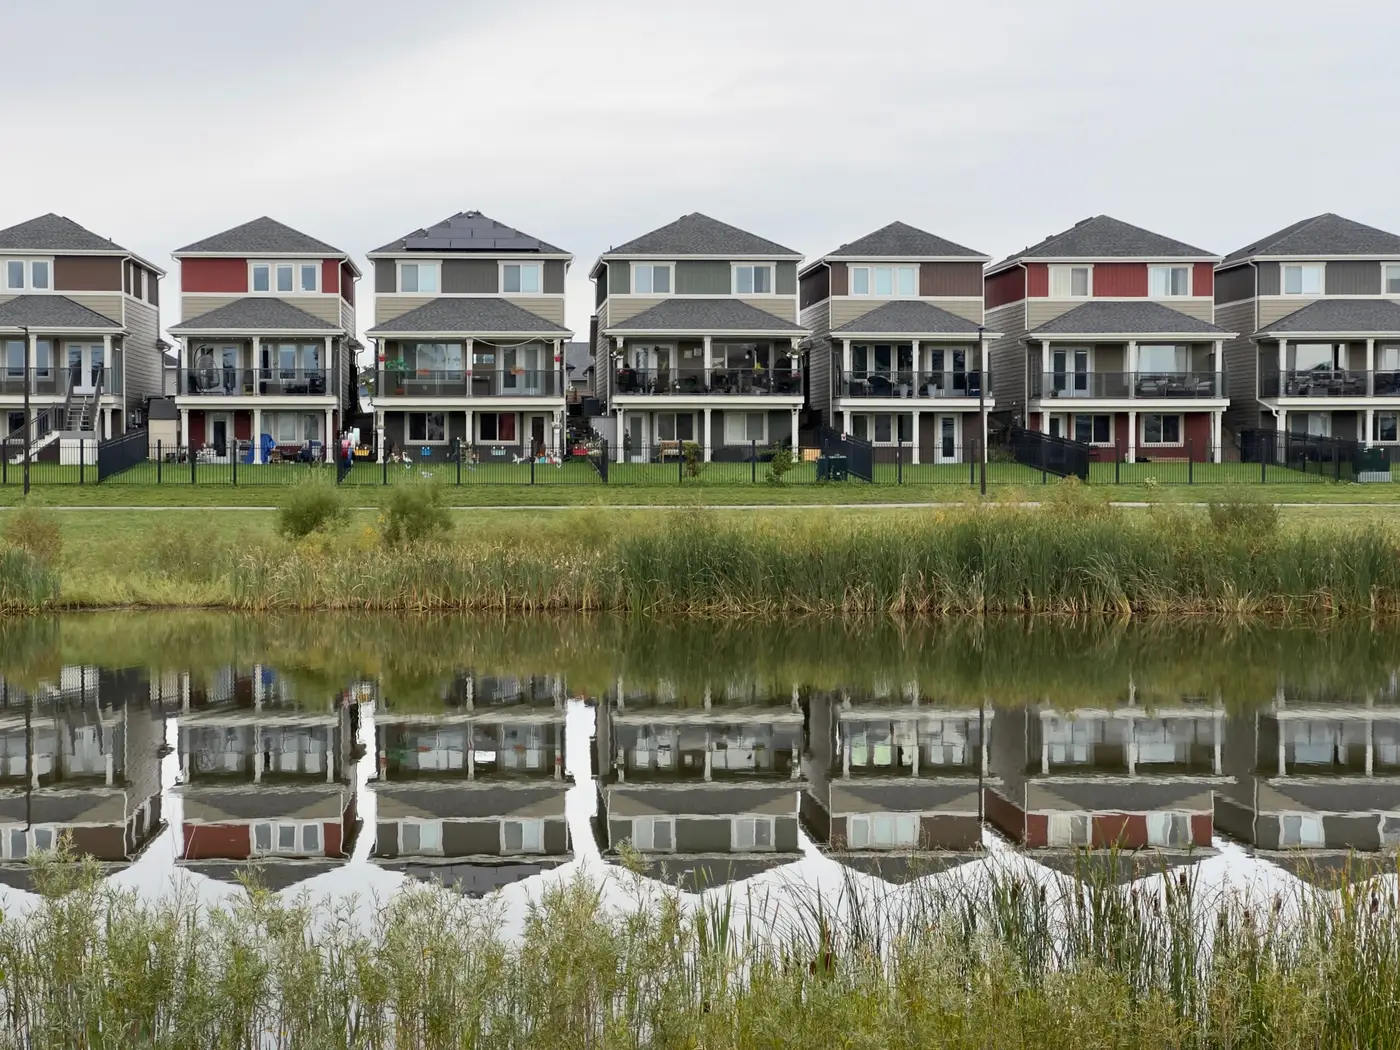 Field notes: the subdivision that scored green before a single tree was planted
A new-build listing area posted a strong greenness number on bare dirt. The reason comes down to open space counting differently than canopy cover.
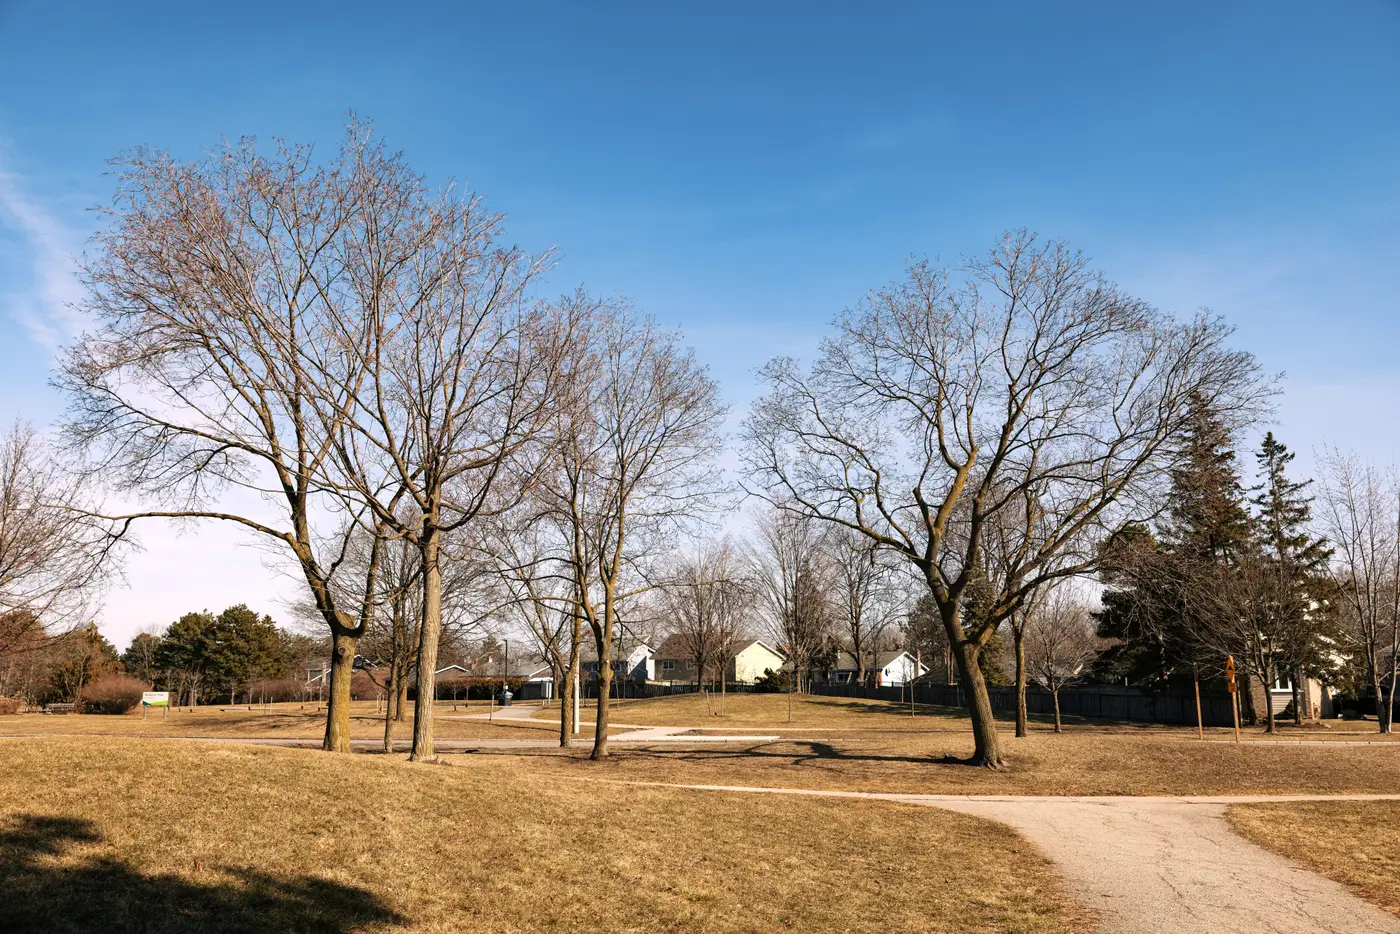 What is a composite location score, and how does it differ from a walkability number
A composite location score combines canopy, open space and paved ground into one figure. Here's how that differs from a single walkability number.
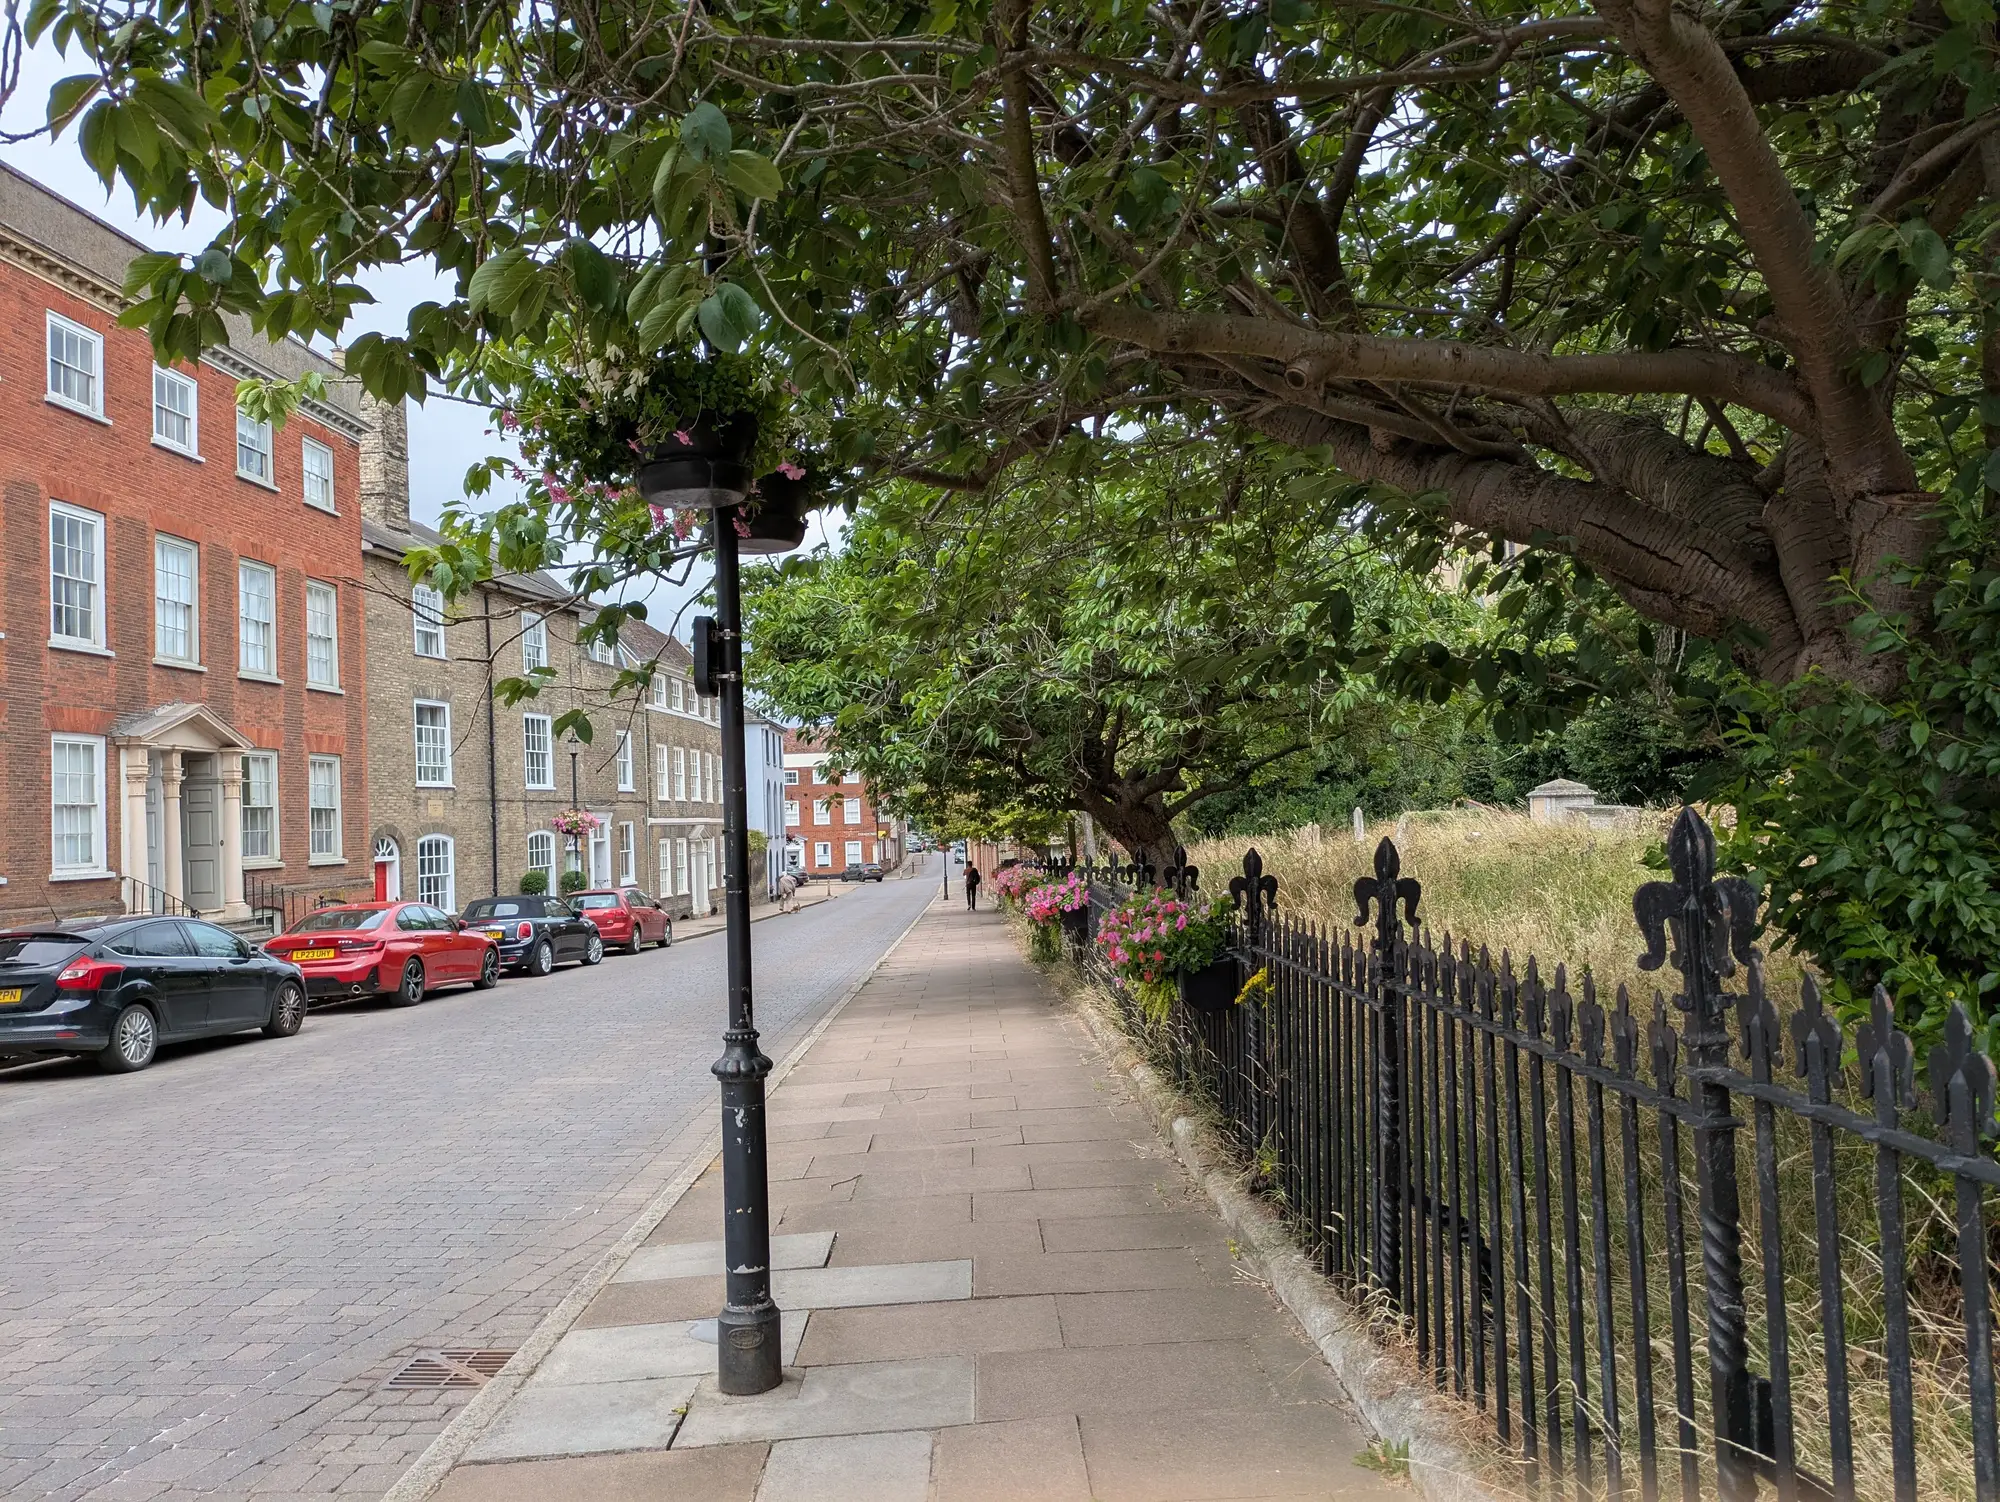 How to explain a greenness score discrepancy to a listing agent
What to say when a listing agent disputes a canopy or greenness score that doesn't match what they see on the street.
- Per-parcel or per-area score: which grain fits a listings page
Why most listings pages need a per-area greenness score, not a per-parcel one, and when parcel-level scoring pays off.
- Field notes: the listing with the mature oak that never moved the score
A mature oak out front, a listing team confused the score didn't shift with it. Why area-level canopy scoring treats one standout tree as a rounding error.
- How to source tree canopy data for a real estate listings site
A practical rundown of where tree canopy data comes from, where NLCD and county GIS layers fall short for listings, and what a usable feed needs.
- Deciduous vs evergreen canopy: why leaf-off imagery skews a greenness score
Why canopy cover reads differently depending on the month a satellite pass was flown, and what that means for comparing greenness scores across listing areas.
- Tree canopy vs. shrub layer: how satellite classification draws the line
How satellite classifiers tell tree canopy from shrub layer, and why collapsing both into one "greenness" number misleads location scoring.
- Walkability score vs greenness score: what each one measures
Walk Score counts proximity to amenities. A greenness score counts canopy, open space and paving. Here's what each one tells a listing page buyer.
- What counts as open space in a location-quality score
Parks, golf courses, cemeteries, vacant lots: what should and shouldn't count as open space when you're scoring a listing area's green appeal.
- How to normalize canopy cover scores across climate zones
Why raw canopy percentage misleads when comparing listing areas across climate zones, and how to build a score that holds up city to city.
- Weighting canopy, open space, and impervious surface in one score
How to combine tree canopy, open space, and impervious ratio into a single, defensible neighbourhood greenness score for listings.
- Impervious surface ratio explained: what it measures and why it matters
A plain-language guide to impervious surface ratio: what counts, how it's calculated, and why it belongs in any neighborhood-quality read.
- NDVI vs. tree canopy cover percentage: what's the difference
NDVI measures plant vigor broadly. Canopy cover percentage measures tree crowns specifically. Why the difference matters for listing-area scores.