Impervious ratio vs canopy cover: which one moves the score more?
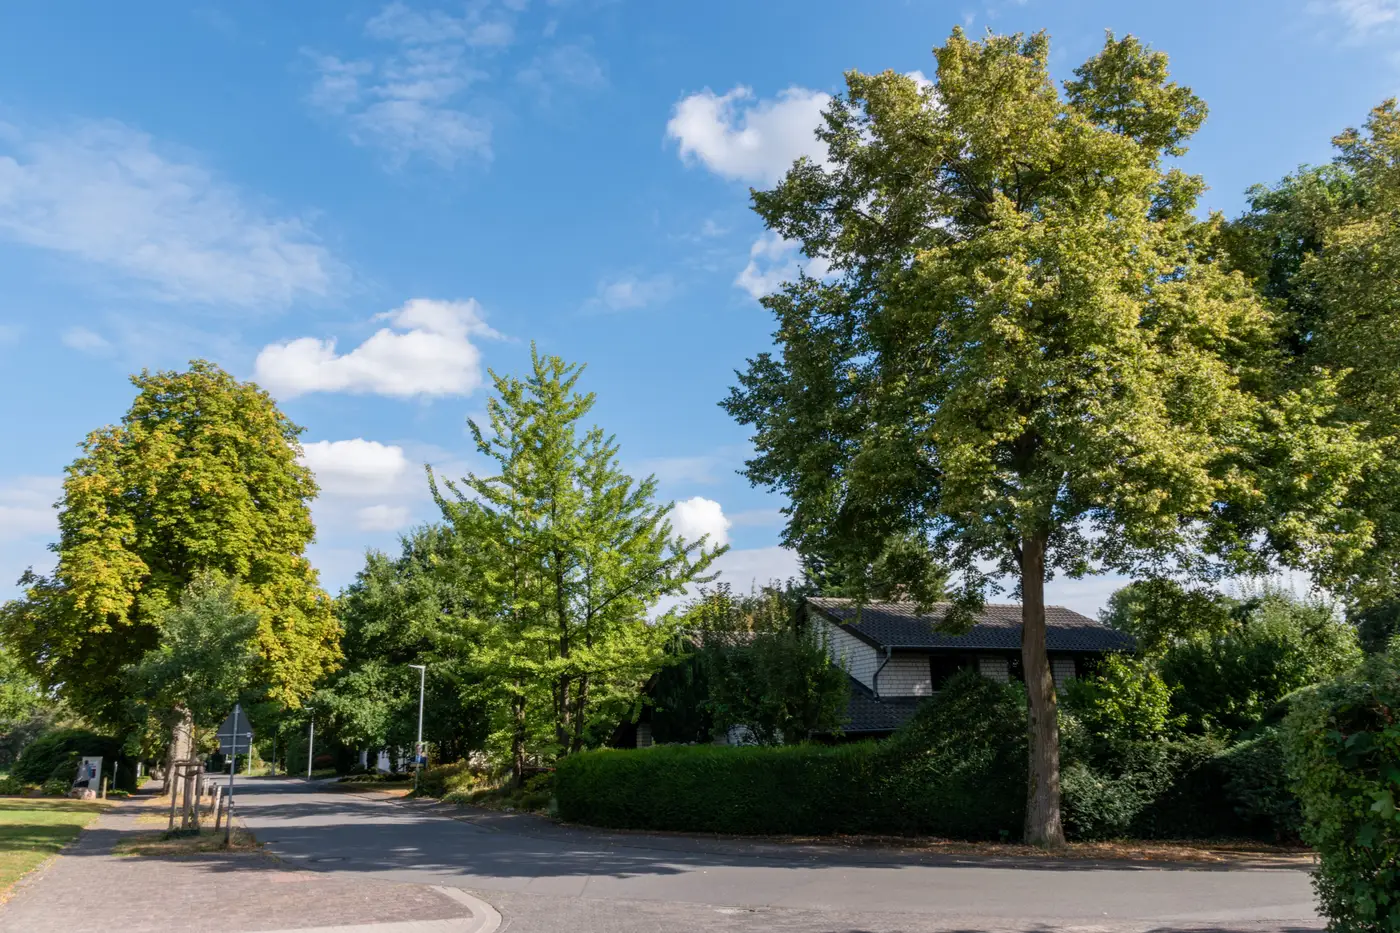
Does canopy cover or impervious surface percentage do more of the work when a location-quality score moves? In most suburban comp sets, impervious ratio swings wider block to block, so it usually pulls harder on a blended score, even at equal weighting. Wooded, large-lot suburbs can flip that pattern. Here's the breakdown worth running before you lock in your own weights.
Canopy cover and impervious ratio measure different things
Canopy cover is the share of a parcel or block seen from above that's covered by tree crowns. It's a proxy for shade, for mature street planting, for the kind of neighborhood feel that shows up in listing photos as leafy and established.
Impervious ratio is the share of surface that water can't soak through: roofs, driveways, parking, roads, sealed yards. It's a proxy for runoff, for heat retention, and often for how built-out a block already is relative to its lot sizes.
A block can score low on both (a new build on bare dirt), high on both (a dense urban block with street trees over a sea of asphalt), or split in either direction. Treating them as two readings of the same thing is the first mistake, because they don't move together in a predictable ratio.
Why impervious ratio often has the bigger swing
Across a typical suburban comp set, canopy cover tends to cluster. Most blocks in an established area land somewhere in a fairly narrow band, because tree planting ages and spreads at roughly the same rate across a subdivision built in the same decade. The variance block to block is real but modest.
Impervious ratio spreads wider. Lot coverage rules differ, driveway and parking choices differ, and infill or additions change a parcel's paved share faster than a tree canopy changes. In a lot of metro comp sets, you'll see impervious surface percentage range from under 20% to over 70% within the same zip code, while canopy cover for the same set might only range from 15% to 45%.
A wider input range pulls harder on a blended score, even at equal weighting. That's the part analysts miss when they assume "greenness" means canopy and stop there. If your score weights canopy cover and impervious ratio the same, impervious is usually doing more of the heavy lifting simply because it has more room to move.
This flips in older, heavily wooded suburbs where lot sizes are large and paving is light. There, canopy variance can widen past impervious variance, and the canopy term starts to dominate instead. Run the variance on your own comp set before locking in a weighting, since a scheme built for one metro rarely transfers cleanly to another.
What this means for weighting your score
A location-quality score built from these components should let the analyst see both inputs separately before they get collapsed into one number. If a listing area scores low overall, you want to know whether that's a canopy problem, an impervious problem, or both, because they read differently to a buyer. Low canopy with low impervious reads as "new development, not grown in yet." High impervious with decent canopy reads as "dense but shaded." Those are different stories for the same blended score.
This is the gap between a single generic walkability number and a score built from imagery components you can actually decompose. Greenness Scoring pulls canopy cover, open space and impervious ratio from high-res multispectral imagery for a listing area and hands back the blended score alongside the three inputs that built it, refreshed annually, so you can see which component is pulling the number before it goes anywhere near a listing page.
If you're deciding how much weight canopy and impervious should carry in your own model, start by pulling the component breakdown for a neighborhood you already know well.