Tree canopy vs. shrub layer: how satellite classification draws the line
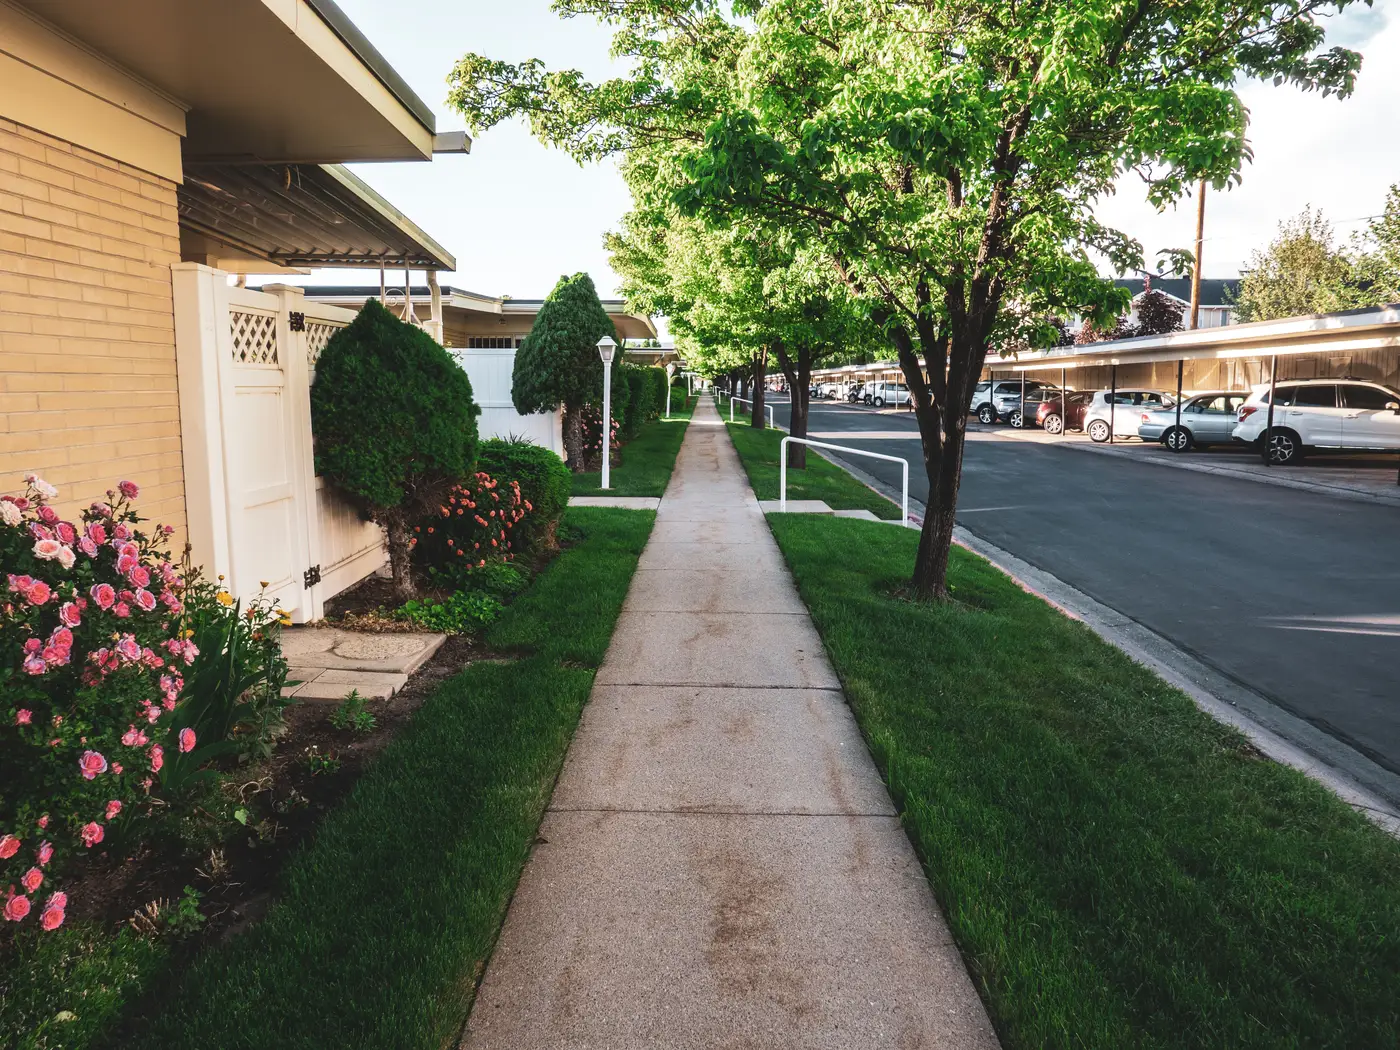
If you've pulled a greenness layer for a listing area and wondered why a block full of hedges and parking-lot planters scored differently than a block with three mature oaks, the answer is in how the imagery classifier draws the line between canopy and shrub. The classifier follows rules about height, crown shape, and spectral signature, and those rules explain why two neighborhoods that look equally green on a drive-by can land on opposite ends of a score.
Why canopy and shrub get classified differently
Canopy cover, in most vegetation classification schemes, refers to woody vegetation above a minimum height threshold, usually somewhere in the 2 to 5 meter range depending on the source dataset, with a crown that casts a continuous or semi-continuous shadow when viewed from above. A shrub layer sits below that threshold. It's woody too, but it stays low and grows in dense clumps: foundation plantings, hedgerows, scrub regrowth after a clear-cut, the landscaping strip along a strip mall.
From directly overhead, at 0.5 to 2 meter resolution, a classifier isn't measuring a tape-measure height. It's working from proxies: shadow length and direction (which imply a taller object casting the shadow), crown shape and texture (trees tend to have rounder, more irregular crown boundaries than clipped shrubs), and spectral response in the near-infrared band, where healthy woody vegetation of any height reflects strongly but the texture and context around the pixel still separate the two classes. A single pixel of high NIR reflectance doesn't tell you canopy versus shrub on its own. The surrounding pixels, the shadow geometry, and sometimes a digital surface model derived from the same pass do that work.
This is also where a lot of generic greenness indices get sloppy. An NDVI-only approach treats a front lawn, a boxwood hedge, and a 40-foot maple as the same thing: all vegetation, all "green." For scoring neighborhoods, that's a real problem. A buyer searching for tree-lined streets isn't looking for a score that rewards turf and parking-lot shrubs equally with mature canopy. The two have almost nothing in common as a location amenity, even though both show up as "vegetated" in a coarse classification.
What this means for a canopy cover definition on a listing page
A usable canopy cover definition for real estate or location-quality purposes needs to specify the height floor, tied to what the source imagery and resolution can resolve, and needs to distinguish tree canopy from the broader category of open space or green space, which includes shrub layers, turf, golf courses, and vacant lots. These are different things for a listing area:
- Tree canopy is the shade-and-maturity signal. It tracks with established, slow-to-change tree cover, visible overhead as discrete or merged crowns.
- Shrub layer is lower vegetation that can appear or disappear in a single growing season and doesn't carry the same walkability or shade value.
- Open space is a broader land-use category: parks, undeveloped lots, golf courses, which may or may not have canopy on them at all.
Collapsing all three into one "greenness" number hides which one is actually driving the score. A neighborhood with a golf course on its edge and no street trees reads very differently to a buyer than one with full canopy cover over every block, even if a naive vegetation index scores them similarly.
Splitting canopy, shrub, and impervious surface into separate layers derived from the same imagery pass lets a location-quality team see what's driving a score, instead of reading one blended index. That makes it possible to weight canopy maturity differently from raw open-space acreage when it matters for how a listing area gets presented.
Greenness Scoring builds its location-quality score from exactly this kind of layered classification, splitting canopy cover, open space, and impervious ratio out as separate components from high-res multispectral imagery, refreshed annually, so a neighborhood's score reflects what's growing there and not just a generic vegetation index.
If your scoring pipeline currently treats all green pixels the same, it's worth seeing what the canopy component looks like on its own.